Holiday Demand Check-In: What Amazon Data Says About Byrna Heading Into 2026
Disclaimer: Not investment advice. Do your own research. I’m currently long.

Q4 is Byrna’s ($BYRN) most important quarter. Holiday buying drives the strongest revenue of the year, which provides an opportunity to assess the real health of demand across Byrna’s product mix and the broader self-defense category.
This Holiday Check-In & 2026 Outlook builds upon my earlier piece: A Shot at Safety: How Byrna ($BYRN) Is Building Consumer Momentum, which I’d recommend reading if you’re unfamiliar with the company.
Since publishing that article on 11/4, the stock slid roughly 15% and nearly 40% from its October highs, before grinding back to around the same 11/4 levels in recent days. Rather than signaling deteriorating fundamentals, these dips now look like a technical bottom, because every piece of Amazon demand data I track (Keepa BSR, discount elasticity, keyword volume) indicates that we should be confident with Q4, but let’s dig into the data.
Section 1 - Q4 Amazon Demand Check-in
Amazon remains one of Byrna’s largest online sales channels, representing roughly 34% (Q3 2025 to date) of online revenue as of mid-2025. While Byrna has diversified significantly into dealer networks, chain retailers, and international markets, Amazon continues to offer the most transparent, real-time signal of consumer demand patterns.
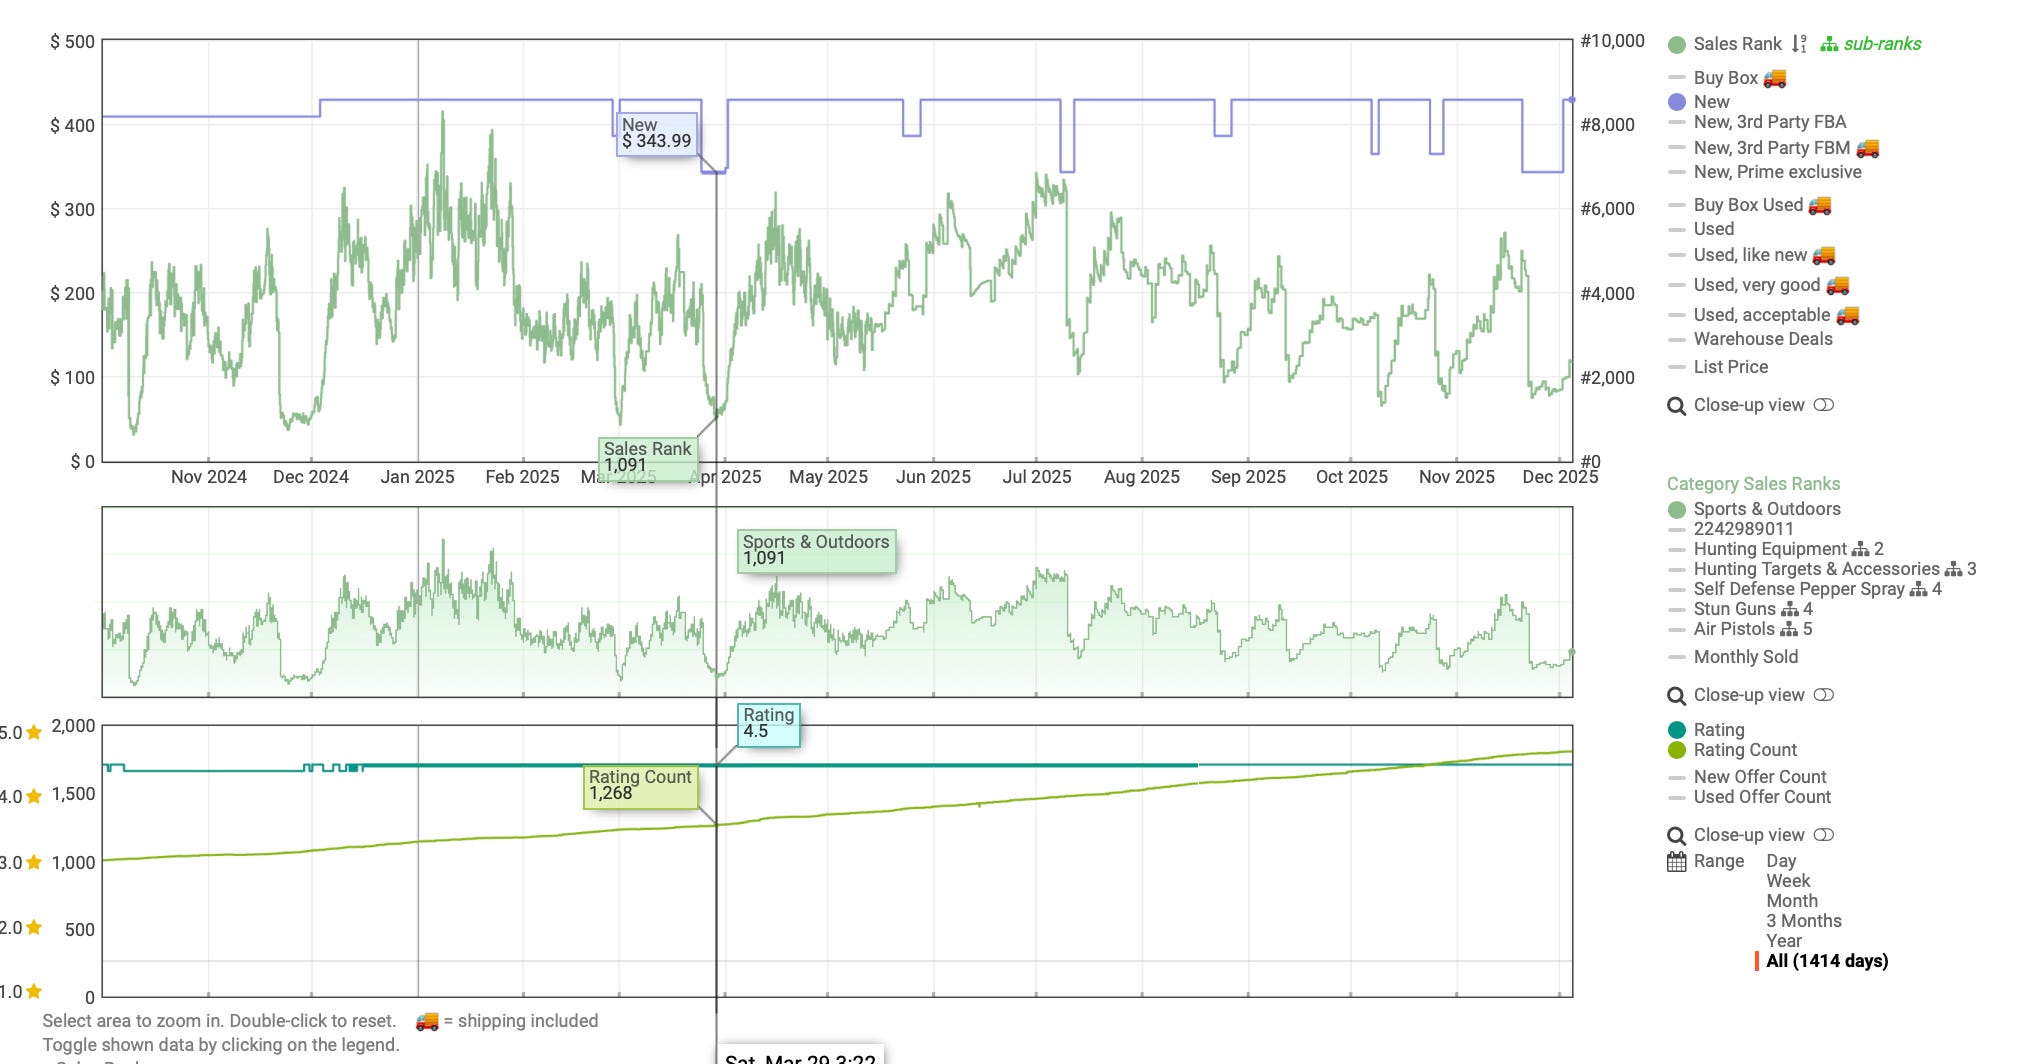
Amazon’s Best Seller Rank (BSR) is a real-time indicator of a product’s sales velocity within its category, where a lower number reflects stronger relative sales. Importantly, BSR is not a direct measure of unit volume, it fluctuates with competitor promotions, category traffic, and pricing dynamics. All BSR data herein is sourced from Keepa’s historical dataset of Amazon rankings. Daily BSR charts alone paint a volatile, sometimes bearish picture. But when we shift to monthly averages, the appropriate level for identifying real trends, the story changes substantially.
1.1 Pistols: Stable SD Performance, Softer LE Trends, and a Strong Early CL Ramp
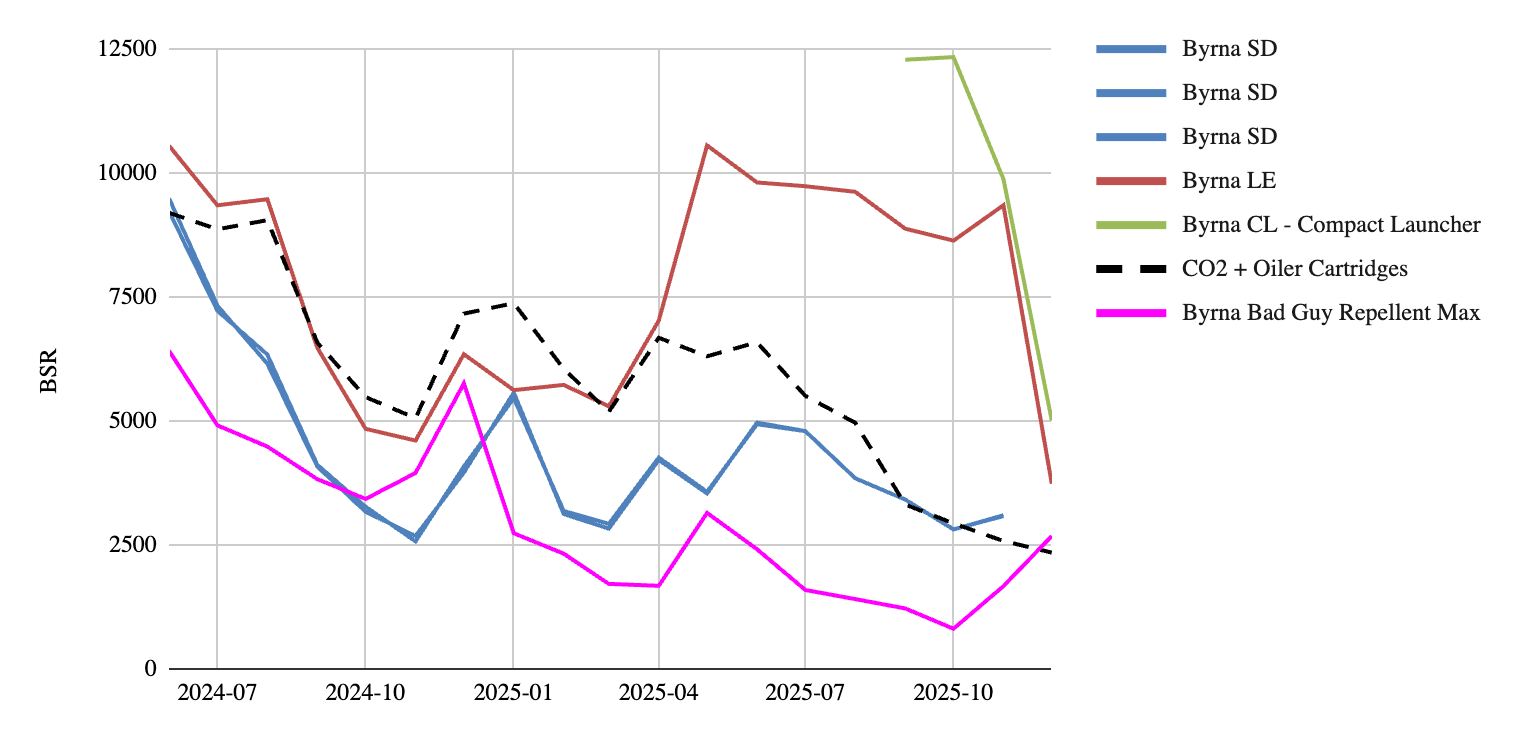
The combined monthly-average BSR chart (Figure 1) shows differentiated yet broadly stable pistol performance:
SD: Monthly averages have matched or slightly exceeded last year’s performance, reflecting stable demand and more consistent month-to-month conversion.
LE: After an exceptionally strong 2H 2024, LE shows higher BSR levels through early-mid 2025 before gradually improving again into Q4. This pattern reflects normalization off peak comps rather than structural weakness and is reasonable given Byrna’s launch of a new product this year with the Compact Launcher (CL).
CL: As the newest pistol, the CL has shown a healthy early ramp, quickly settling into the same BSR range as SD and LE. Its introduction naturally redistributes category velocity from two pistols to three.
1.2 CO₂ and Spray: Distinct but Complementary Indicators of Ecosystem Health
Within the combined monthly-average chart (Figure 1), CO₂ and Spray provide valuable but different signals about Byrna’s consumer base.
CO₂: A Direct Measure of Device Utilization - CO₂ cartridges (as well as projectiles discussed later) remain the cleanest proxy for active device usage. Owners only replenish CO₂ when they are firing or practicing with their launchers, making the category a reliable engagement metric.
CO₂ maintains a smooth, stable trendline throughout 2025, with several months showing slight year-over-year strength, indicating a healthy cadence of device usage across the installed base. Unlike pistols, CO₂ sales are minimally influenced by discounting, which strengthens its value as a true utilization signal.
Spray: A Low-Barrier Entry Point Supporting Broad Demand. Chemical spray (Bad Guy Repellent), on the other hand, reflects category-level demand rather than device utilization. The product is:
Significantly cheaper
Easier to carry and deploy
Less intimidating than launchers
Purchased by both Byrna owners and non-owners
It also competes in a crowded and highly competitive self-defense subcategory on Amazon, with numerous established brands, frequent promotions, and large seasonal influxes of lower-cost alternatives.
Against that backdrop, Byrna’s Spray performance is notable:
Its stable trendline and clear seasonal strengthening into Q4 signal ongoing consumer interest in Byrna’s broader ecosystem, despite intense category competition.
However, because spray is not tied to launcher ownership or usage, it should be interpreted as a strong ancillary revenue stream that broadens Byrna’s reach, rather than a core measure of device engagement.
Combined Interpretation - Taken together, the CO₂ and Spray trends provide a multidimensional view of ecosystem health. CO₂ confirms active engagement among existing device owners, showing that users continue to replenish and use their launchers at a steady rate. Spray, while not tied to launcher usage, highlights Byrna’s ability to compete effectively in a crowded, price-sensitive self-defense category and serves as a strong ancillary revenue stream that broadens reach beyond the core launcher customer. Both trajectories reinforce that underlying category interest remains solid, providing important context for interpreting variability in pistol-level BSR.
1.3 Ammo: Also Below Last Year’s Highs, but Improving Quarter-over-Quarter
Ammo performance, monthly‐average BSR trends, for Byrna’s projectile SKUs, Kinetic and MAX, show a more nuanced picture than the clearer utilization signals seen in CO₂. As expected, pepper balls are notably absent from the charts, which is consistent with their more limited use case (single-event defense rather than routine training or practice). Their lower sales volume and less frequent replenishment make them a weaker Amazon signal compared to other ammo types.
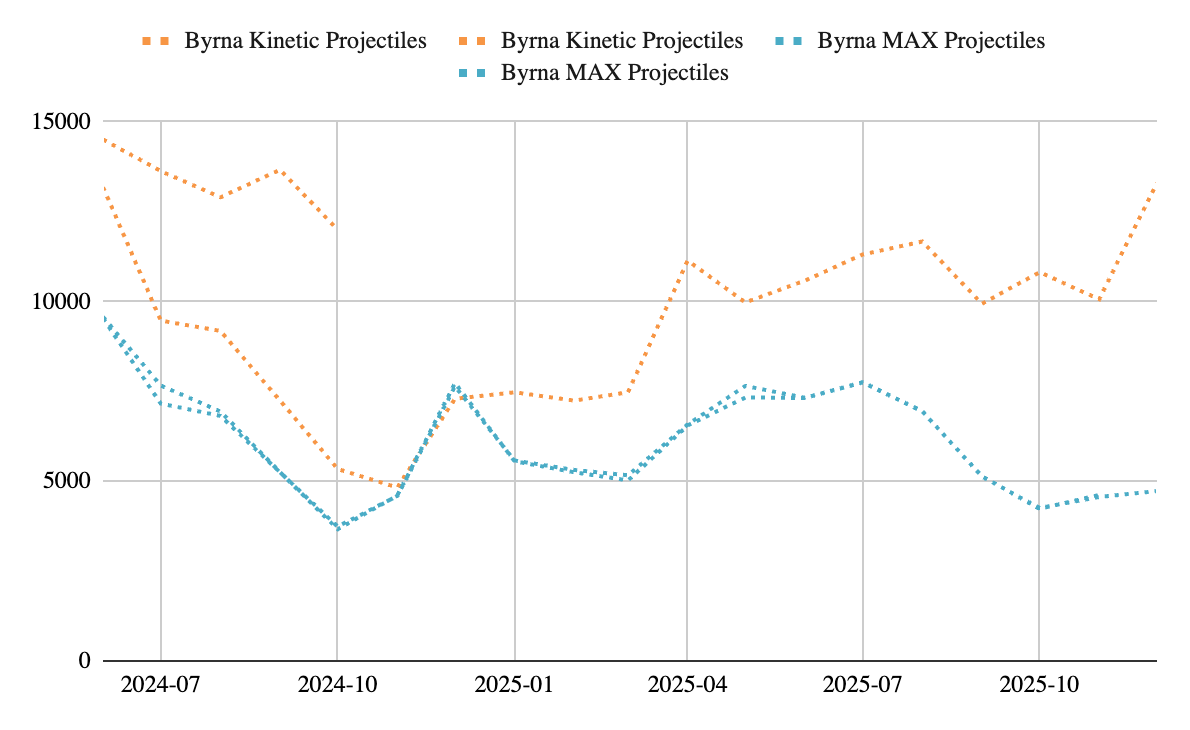
The monthly-average BSR trends for projectile SKUs follow the expected early-year reset and mid-year stabilization. However, the two major ammo lines diverge in 2025 in a meaningful way (figure 3):
MAX projectiles have shown the most stable performance, maintaining a relatively consistent BSR range throughout the year and displaying a smoother trajectory across most months.
Kinetic projectiles have not shown the same improvement into the holiday period. Instead, Kinetic has remained at higher (weaker) BSR levels through late 2025, without the same firming or seasonal lift visible in MAX.

Figure 3. Monthly Average BSR Trends for Byrna Kinetic and MAX Projectiles. MAX projectiles have maintained the most stable BSR performance throughout 2025, while Kinetic appears to be lagging with higher (weaker) average rankings. Part of this divergence may reflect a data-capture limitation, as multiple Kinetic SKUs exist across Amazon and may not all be represented in the dataset.
This difference may partially reflect real user behavior, as MAX rounds are often preferred for certain use cases, but it may also stem from data-capture limitations or difference in channel mix. Kinetic rounds are sold across multiple SKUs on Amazon, and the dataset may not fully capture all of them, making the trend line more prone to distortion or partial visibility. Moreover, the channel mix for ammo, especially kinetic projectiles, could lean heavier towards the channels outside of Amazon.Given these factors, ammo should be interpreted as partly supporting the bull narrative, but also a reason to still be diligent. The category does not indicate deterioration, but it also does not signal the same consistency or seasonal lift that other Byrna consumables display.
Overall, the monthly averages show a stable but uneven pattern, aligned with normal category dynamics rather than clear acceleration. With Byrna’s valuation reflecting expectations for continued ecosystem growth, the relative softness in Kinetic, regardless of its cause, is something to monitor, even if it does not currently signal a fundamental demand issue.
Section 2 - Triangulating BSR with Reported Financials
The most important step in evaluating Byrna’s holiday momentum is aligning the Amazon BSR trends with the company’s reported financial performance. As outside investors, we don’t have real-time visibility into channel mix (including the exact percentage of sales flowing through Amazon) or unit-level volumes, which makes BSR interpretation inherently indirect. At first glance, the daily Amazon charts, especially for pistols, look softer than last year’s extreme Q4 lows, which is why I prefer assessing the monthly and quarterly averages, where the underlying signal becomes far clearer.
To understand whether this pattern reflects true demand softness or simply noise, it is essential to triangulate the Amazon data with Byrna’s actual reported financials. Through the first three quarters of 2025, Byrna delivered steady revenue performance that remained close to the strong levels set in Q4 2024, which is not what Amazon BSR alone would have predicted, particularly for LE and the projectile categories, where daily and even monthly trends appeared softer throughout 2025 vs Q4 2024. By contrast, the SD platform has shown more consistent and stable performance, reminding us that not all SKUs follow the same trajectory on Amazon.
Gross margins have also held in the low 60% range, showing no material erosion that would suggest deteriorating unit economics or weakening customer interest. This consistency implies that, despite volatility or apparent softness in certain Amazon SKUs, overall demand across the business has remained stable. It also reinforces that Amazon BSR has become a less reliable 1:1 indicator of total performance as Byrna’s channel mix diversifies and velocity spreads across a broader, three-platform pistol lineup.
Several factors likely contribute to this growing disconnect:
Amazon’s share of total sales has declined as Byrna expands through direct-to-consumer, dealer networks, chain retail, and international distribution.
The Compact Launcher (CL) now absorbs a portion of category velocity, mechanically lifting (weakening) the BSR of SD and LE relative to 2024.
Promotional strategy has shifted, with deeper and longer-running discounts across all pistols in 2025, which influences both conversion and BSR comparability.
Category volatility is higher, and daily BSR exaggerates both peaks and troughs compared to underlying demand.
When viewed through this broader lens, the divergence between BSR data and actual financial performance suggests that Amazon trends are directionally useful but no longer determinative. The triangulation across monthly BSR, consumables strength (especially CO₂ and Spray), and reported financials supports the conclusion that underlying demand remains healthy heading into Q4, even if the shape of Amazon performance differs from last year.
At the same time, Byrna’s valuation still embeds expectations for continued growth, making it important to monitor areas where BSR trends appear less robust—such as LE and projectiles—even if the current financial results do not indicate deterioration. In a market that prices in forward momentum, these nuances matter.
3. Outlook, Limitations, and What the Market Is Pricing In
Interpreting Byrna’s holiday momentum requires balancing what we can see (Amazon BSR, promotional patterns, financials through Q3) with the realities of what we cannot observe as outside investors. While the data points discussed above are encouraging, this analysis comes with several inherent limitations that should temper how literally we take any single indicator.
3.1 Limitations of External Signal Tracking - Amazon remains the cleanest real-time channel we can monitor, but it represents only a fraction of Byrna’s total business (34% of online sales in Q3 2025, up from 27% at the end of Q2 2025 and just 12% in Q2 2023). That’s meaningful, but:
We don’t know what share of total revenue that represents.
We don’t have unit-level sell-through across DTC, dealer, and retail channels.
Multiple SKUs (especially in projectiles) complicate clean BSR tracking.
Importantly, Q4 FY25 is incomplete and the monthly average BSR for December will likely pull back higher as we get further away from the Black Friday / Cyber Monday holiday shopping stretch.
As a result, Amazon BSR is best treated as a directional signal—useful, but incomplete. The divergence between SD vs. LE vs. projectiles on Amazon, contrasted with relatively steady company-level results, underlines why over-reliance on BSR would be misleading.
3.2 What the Financials Tell Us About Underlying Demand and What the Market Is Pricing In
Quarterly financial results provide the clearest view into Byrna’s true underlying demand, one that often diverges from what Amazon BSR alone would suggest. Through the first three quarters of FY25, Byrna has delivered consistent top-line strength and rapidly improving profitability, even as certain Amazon categories (notably LE and some projectiles) show choppier signals.
Q1–Q3 FY25 Performance: A Strong, Scaling Business
Revenue Growth:
Q1 2025: $26.19M, +57% YoY
Q2 2025: $28.51M, +41% YoY (record quarter)
Q3 2025: $28.18M, +35% YoY
Total YTD revenue: $82.87M, up 43% YoY.
Profit:
Q1 net income: $1.662M (vs. $17k in Q1 2024)
Q2 net income: $2.427M (vs. $2.077M in Q2 2024)
Q3 net income: $2.235M (vs. $1.025M in Q3 2024)
Total YTD net income: $6.324M, up 103% YoY.
Margins Hold Firm - Q3 gross margin came in at ~60% (vs. 62.4% in Q3 2024), which management expected as we discussed earlier.
Reconciling Amazon With the Financials
If you had only looked at Amazon BSR for LE and some projectile SKUs, you might have expected a sharper slowdown. Instead, the financials show:
SD/SE stability
CL contributing meaningfully in its first full year
Non-Amazon channels expanding (dealer, retail stores, Sportsman’s Warehouse pilot)
Higher-margin DTC still strong despite heavier holiday discounting
This explains why Amazon soft spots do not map cleanly onto company-level results. As Byrna diversifies channels and expands brick-and-mortar presence, this divergence will likely widen over time.
But What About the Slowing YoY Growth Curve? Quarterly YoY revenue growth has moderated: Q1: +57%, Q2: +41%, Q3: +35%. Objectively, this reflects growth normalization, not demand erosion. Byrna is now comping against the extraordinary hypergrowth of FY24, when revenue doubled and Q4 alone grew 79% YoY. Absolute revenue remains at record levels quarter after quarter, sequential trends are stable, and profitability is scaling faster than revenue. Byrna is transitioning from hypergrowth to sustainable, higher-quality growth.
What Q4 Must Deliver to Hit FY25 Guidance? Management’s full-year revenue guidance of $116–119M implies Q4 revenue of $33–36M (+18–29% YoY). On the earnings side, Byrna needs $2.7–3.7M in Q4 net income to reach the ~$0.40 EPS consensus. YoY growth is not as relevant for income as Q4 24 had a one time $5.634M tax benefit that inflated Q4 FY24 results. Regardless income would need to be roughly even (-8% YoY from adjusted Q4 FY24 earnings) to hit $0.40 consensus.
In practical terms, a $34–36M Q4 aligns with Byrna’s historical Q4 strength and the signals from SD and CL BSR. It requires:
A normal seasonal lift off Q3’s $28.18M
Solid SD demand, CL contributing meaningful volume in its first full holiday cycle, LE returning to BSR levels previously seen in Q4 FY24 to early Q1 FY25.
Healthy holiday pull-through in consumables/accessories
Anything below ~$33M suggests deceleration; anything above ~$36M strengthens the bull case.
Similarly, Byrna does not need to reproduce last year’s extraordinary, tax-boosted Q4 net income. It simply needs to deliver a normal, profitable holiday quarter with revenue in the $34–36M range and gross margins starting to tick up, but at the very least around ~60%. If Byrna hits those marks, I expect the company will pretty easily meet or exceed consensus EPS expectations.
Key Questions Heading Into Q4 and 2026
As the most important quarter of Byrna’s fiscal year continues, the debate is no longer about whether the business is growing (Q1–Q3 results make that clear), but whether the quality, efficiency, and durability of that growth can support the valuation investors are assigning to FY26 and beyond. The holiday quarter will answer several questions that have been building since my first article on Byrna earlier this year.
Can Byrna Sustain Awareness-Driven Demand Without Overspending? In my first piece, I highlighted what the Harvard–Stanford study made unambiguous: Byrna’s biggest opportunity and biggest risk is awareness. Only 21% of firearm owners had heard of Byrna, yet awareness alone meaningfully increased purchase intent and substitution willingness. Q4 is where this dynamic matters most. Can Byrna convert growing awareness into efficient, profitable holiday demand without leaning too heavily on discounts (which have been slightly steeper FY25 than FY24) or paid traffic?
Is the Marketing + Channel Strategy Scaling, or Getting Spread Too Thin? Byrna now executes across a wide front: DTC, Amazon, retail pilots (Sportsman’s Warehouse), brick & mortar company stores, influencer partnerships, paid media, AI-optimized campaigns, and the launch of a new platform (CL Pistol). This diversification has powered growth, but also introduces risk. The company must show in Q4 that its marketing engine and channel strategy is truly compounding, not simply expanding.
Does Consumer Health Support Holiday Conversion? Byrna’s products are discretionary ($300–$600 launchers with accessory pull-through). Q4 depends heavily on consumer willingness to spend on “security + gifting.” The financials through Q3 show stable demand and strong sequential revenue, but the Q4 setup stands against a backdrop of a potentially softer consumer confidence / economy (overall mixed signals), rising credit balances, and potentially subdued discretionary e-commerce environment (although Amazon had a record breaking Black Friday / Cyber Monday). The question for Q4: Does Byrna’s category (self-defense + personal security) behave more like a staple or a discretionary good under macro pressure?
Is Byrna Building a Durable Business in a Durable Category? Since 2021, Byrna has evolved into a more mature company, one with 60% gross margins, rising ROE, and a growing installed base of recurring-spend customers. But durability isn’t just about Byrna. It’s also about the non-lethal self-defense category itself.
This is a segment with several structural tailwinds:
Rising interest in alternatives to firearms
Safety concerns in urban and suburban markets
Increased adoption among first-time, risk-averse buyers
Growing retailer willingness to carry non-lethal products
Strong repeat-purchase economics (CO₂, projectiles, accessories)
The core question heading into 2026 is: Can non-lethal self-defense mature into a mainstream, durable consumer category and is Byrna positioned to be its leading brand?
Conclusion
Q4 remains Byrna’s most important proving ground. Not because the business needs a heroic quarter, but because it offers the clearest window into how demand, profitability, and category momentum behave when everything converges: seasonality, awareness, marketing scale, macro conditions, and product ecosystem engagement. Through the first three quarters of FY25, Byrna has shown that the core engine is healthy: revenue is up 43% year-to-date, net income has more than doubled, gross margins have held near 60%, and the company continues to add both breadth (CL platform, new stores, retail expansion) and depth (repeat purchases, CO₂ utilization, accessory attachment) to its model.
The Amazon BSR narrative looks uneven on the surface, especially for LE and certain projectile SKUs, but triangulating BSR with financial performance makes the picture clearer: underlying demand remains intact, SD and CL are stable anchors, CO₂ continues to reflect a highly engaged installed base. Q4 simply needs to be a normal Byrna holiday quarter: revenue in the $34–36M range, stable margin mix, and roughly $3M in net income. If the company hits those marks, FY25 consensus should be comfortably met.
The bigger story shifts to 2026. Byrna is now competing across a category with structural tailwinds, rising interest in alternatives to firearms, increased safety consciousness, and growing retailer acceptance of non-lethal options. The durability of the category is becoming as important as the durability of the company, and the data increasingly supports the view that non-lethal self-defense is not a passing fad but an emerging consumer segment with staying power. Byrna’s improving economics, expanding installed base, maturing marketing engine, and channel diversification position it well to be the defining brand in that space.
Markets have been quick to punish Byrna on volatility, sharp drawdowns, potentially overreactions to daily BSR swings, and elevated short interest have amplified noise. But the fundamentals keep trending in the opposite direction: more customers, more usage, more replenishment, better margins, stronger balance sheet, and a clearer path to sustained profitability.
My view remains unchanged from my first article and reinforced by everything in this update: If Byrna delivers a solid Q4, the setup for 2026 is increasingly compelling. You have a growing category, a company strengthening its moat, clear levers for scale, and a valuation that still reflects skepticism rather than enthusiasm. For a business executing at this level, that combination is a bullish place to be.